March 20 marks the 20th anniversary of the Iraq War. Initially, the war had substantial majority support, saying it was “worth it”. But that fell rapidly and by July 2004 as many said it was “not worth it”. By 2008 we reached near 65% not worth it, which is little changed.
Three aspects of Iraq War opinion. (Created 11/5/2007).
A look at overall opinion shows that the public is not keen on either Biden or Trump running for president again in 2024. Of all registered voters interviewed in the November 2022 and January 2023 Marquette Law School Poll National surveys, 34% would like Biden to run and 29% would like Trump to run.
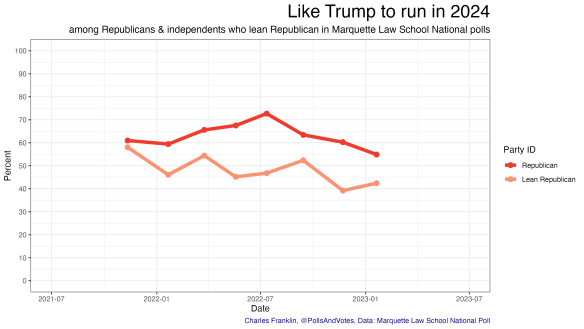
Among only registered voters who consider themselves Democrats or independents who lean Democrat, 49% would like Biden to run. Among registered voters who are Republican or independent but lean Republican, 53% would like Trump to run.
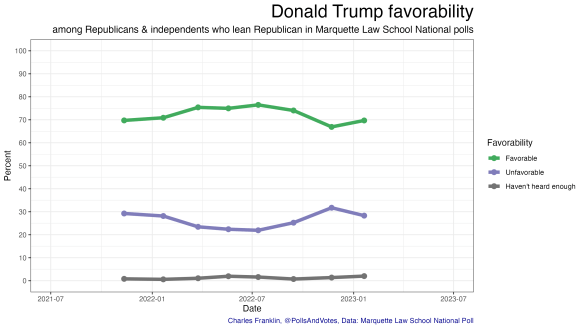
This even split in both parties comes despite generally favorable views of both Biden and Trump among registered voters of their party. Biden is viewed favorably by 82% of registered Democrats and Trump is viewed favorably by 68% of registered Republicans.
While Democrats are more favorable to Biden than Republicans are to Trump, there is reluctance among Democrats for a Biden run in 2024 even among those with a favorable opinion of him, 57% of whom wish him to run. Among Republicans who are favorable to Trump there is higher support for a run, 72%.
Strength of partisanship also plays a role with Democrats more supportive of a Biden candidacy than are independents who lean Democrat, and likewise for Trump among Republicans compared to independents who lean Republican.
Among all registered voters, 42% say they would like neither Biden nor Trump to run in 2024, 28% would like Biden but not Trump to run and 24% would like Trump but not Biden. And only 5% would like to see a rerun of 2024.
Nate Cohn has a look at widely varying polls on Trump 2024, including my @MULawPoll. Worth a read.
It is hard to get apples-to-apples comparisons. Different question (long list of candidates or DeSantis-Trump head-to-head), RVs or likely primary voters, Reps or Reps+Lean.
I’d also stress value of comparative favorability among Reps.
And comparison of ONE poll over time with same methodology each time removes noise due to multiple pollsters w varying methodology. This emphasizes trend change w most comparable data available
Favs in @MULawPoll national surveys:
Another trend for want Trump to run, and shows the difference between those who are more partisan Republicans and those independents who lean Rep. (How these are included or not also affects the cross-pollster comparison in Nate’s article.)
Here is a comparison of want Trump and want DeSantis to run by party ID for the latest, January 2023 @MULawPoll national poll (all these tweets are based on our national polls, not our Wisconsin only polls.)
I think the most revealing results we have in @MULawPoll is DeSantis is very appealing to PRO-TRUMP Republicans. His fav rating is strong with those Reps also fav to Trump & those Reps who want Trump to run. His threat to Trump is that he’s popular inside Trump’s house.
It is really important to stress we are watching a dynamic process as it unfolds, NOT predicting final outcomes. Trump is ramping up criticism of DeSantis. Does that change things in upcoming polls? When (if) DeSantis enters the race is another test.
It took 15 ballots to elect a speaker, the most in 100 years. In the end, Kevin McCarthy won.
Notably, McCarthy’s support remained quite steady throughout the voting. Opposition held as well but cast votes for a variety of alternations to McCarthy across all the ballots.
Here are the total votes for each candidate on each round of balloting.
Democrats remained united behind Hakeem Jeffries throughout, with one Democratic member elect missing one vote (due to surgery.)
Here are the votes among Republicans who voted for someone other than McCarthy on at least one ballot.
Here is my look at the pre-election polling, as of Nov. 5, 2022.
The raw polling data is from FiveThirtyEight.com, who generously allow download of their polling database. The trends are my estimates and not those of FiveThirtyEight or anyone else.
I include both LV and RV poll results because I believe this reflects uncertainty about turnout, which most do not include in their estimates.
Note the trends as well as the point estimates. The last date of polling is shown in each chart, but most polling was completed a week or more before the election.
Charts are in order of Cook rating of the race and alphabetical within Cook rating (so Solid-D to Solid-R and alphabetical within rating group.
A race had to have at least 5 polls to be included here.
The current conventional wisdom is for the midterm to be somewhat better than average for the president’s party in the House. (I set aside the Senate here.) The fundamentals doubt that, as we’ll see.
The “fundamentals” provide a helpful baseline, even if “non-fundamentals” such as polling, candidate quality, unique issues, may modify that baseline. So let’s only look at historical relationships here.
The starting point is that Democrats currently hold 220 seats in the House, Republicans have 212 and 3 seats are vacant. 218 seats are the minimal majority with no vacancies. 2 of the vacancies were held by Democrats, 1 by a Republican, so call it 222-113 now.
The average loss for the presidents party since 1946 is 26.4 seats. That would put Dems at 196 and Reps at 239. (Note there is very little difference in 1st and 2nd midterm losses on average.)
Losses tend to be larger with less popular presidents. Biden average approval is 41.5% at FiveThirtyEight.com today and 42.4% at RealClearPolitics.com. Let’s call it 42%. It is now October. See the orange line for seat loss by October approval. That fit is a 40 seat loss.
Losing 40 of 222 seats would give Dems 182 seats are Reps 253 seats, considerably worse than an “average” loss of 26 seats. So 196 Dem seats if average, 182 Dem seats if as presidential approval would suggest.
Do note the variation around the orange line. It includes far larger losses, as 1994, and far smaller losses, as 2014. While the best estimate is -40 seats, for a president at 42% approval we see a lot of variation in seat loss, hence uncertainty.
A third fundamental approach combines the loss of popular vote for the House candidates of the president’s party in the prior presidential year and in the midterm. In 2020 Dem House candidates won 51.6% nationwide. But that implies they win only 47.8% in the midterm.
Again notice the variation around the blue line, and we haven’t seen a presidential year close to 51.6% since 1946. So more uncertainty here, but best estimate is a drop on nearly 4 percentage points in popular vote.
So how does popular vote translate to share of seats?
DemSeats% = -25.07 + 1.47*DemVote%
At 47.8% of the vote we’d expect Dems to win 45.2% of the seats, or 197 seats. That is back to an “average” loss, not the larger one based on approval.
There are other factors, even fundamentals, not considered here. The size of the current majority is rather small historically, at least for Democrats. So there are fewer seats and risk, and Dems lost rather than gained seats in 2020.
But there are issues pushing one way (inflation) and issues pushing the other way (abortion). Those are fit topics for a “beyond the fundamentals” analysis, but are not my topic here.
The conclusion is that simple fundamentals suggest a loss of 25 to 40 seats for the Democrats, giving them between 182 and 197 seats and the Republicans between 253 and 238 respectively. Anything in that range would be a strong GOP majority.
I stressed twice above the uncertainty in these estimates. For a given approval or a given national vote share there is considerable uncertainty in the share of seats that result. But if you want to consider the fundamentals, that’s what this gives.
For a “non-fundamental” take, consider the latest CBS News model, based on polling but with a sophisticated model for seats from that poll. As of Oct 16, CBS News estimates 211 Dem seats, a loss of just 11, to 224 Rep seats.
Republicans and Democrats have very different issue concerns in 2022.
GOP pollster Bill McInturff nails it, and my @MULawPoll data in Wisconsin agrees. Reps care about one set of issues, Dems a different set, with little overlap.
If you see Republicans talking about border security/illegal immigration and Dems talking climate change, just look here to see why Compare “Crime”, “Crime in your community” and “Gun violence” for sharp differences by party. Also note less concern by all for crime in your community.
The net balance of party identification has shifted in the Republican direction in 2022, by a little in Kaiser and Marist polls, but a lot in NBC and Quinnipiac polls. One might debate the size but the trend is clear. What it means is perhaps not quite as clear.
Kaiser Net Party ID TrendNBC Net Party ID Trend
The party balance might most obviously shift because people are moving away from the Democratic Party and (likely) into independents, and (likely) from independents and into Republican. In short, real change in the margin.
Democratic approval of Biden has fallen over the year, while Republicans are united in disapproval of Biden (almost unanimously). Inflation is a dominant issue which favors Republicans and damages Democrats. And a Democratic congress has failed to deliver as much as many Democrats had hoped for in early 2021. That is all a recipe for marginal shifts in the party balance, especially at the boundaries between “independent” and either partisan group.
Or the shifts could be because Democrats are “discouraged” by the national political environment (largely for the same reason as above) and are just less anxious to talk to pollsters about politics. In this story the “real” party balance hasn’t changed but Democrats just don’t feel like talking about it. This is cold comfort to Democrats though, since discouraged Democrats not talking to pollsters are also likely Democrats less likely to vote in November, which is also damaging to party prospects.
The recent changes in margin between Democrats and Republican identification are rather large in comparison to shifts we’ve seen earlier in the time series for each pollster. Such trends could reverse before the elections, but time is growing short. And Biden’s job approval has shown no signs of improving, indeed his average continues to slowly decline, now below 40% approval.
Races for Senate and governor may hinge on candidates and the campaigns, so these partisan trends are not the whole story but they add to the national forces that are a drag on Democrats everywhere and a boost to Republicans.
Notes: I look here are “unleaned” party identification, those who say they are “Republicans” or “Democrats”, not including those who say they are independents who lean to either party. This is in part due to limits in the party measures reported by pollsters, with “unleaned” party being the lowest common denominator.
I also use high quality telephone polls that do NOT weight their samples to party ID. This has historically been the “standard” party measure. Most online polls, including Pew, now weight their samples to a party balance estimated from recent telephone polls, which makes tracking trends with samples weighted to party a complicated issue.
Here are the trends for Kaiser, Marist, NBC and Quinnipiac, first for each party and then for the net margin between the parties. Data include the latest polls as of July 5, 2022.
Kaiser Party ID TrendMarist Party ID TrendNBC Hart/Public Opinion Strategies Party ID TrendQuinnipiac Party ID TrendKaiser Net Party ID TrendMarist Net Party ID TrendNBC Net Party ID TrendQuinnipiac Net Party ID Trend
Abortion policy, issue concern and enthusiasm to vote
Are abortion policy preferences linked to motivation to vote and to concern about the issue of abortion, and what role does partisanship play? I assess this using data from the Marquette Law School Poll of 803 Wisconsin registered voters, conducted June 14-20, 2022, a week before the US Supreme Court struck down the Roe v Wade decision on June 24, but well after the draft opinion in this case became public in May.
There has been a consistent majority of Wisconsin registered voters who favor legal abortions in all or most cases, and a minority who say abortion should be illegal in all or most cases. Surveys over the past decade have shown very little change in opinion, as shown in Table 1.
Poll dates
Legal in all cases
Legal in most cases
Illegal in most cases
Illegal in all cases
9/13-16/12
26
34
23
13
9/27-30/12
25
35
23
12
10/11-14/12
25
34
25
12
10/25-28/12
28
32
23
12
10/21-24/13
26
36
25
10
10/23-26/14
24
34
24
15
7/11-15/18
27
36
18
11
9/12-16/18
26
36
21
9
10/24-28/18
26
29
24
14
2/19-23/20
18
37
22
15
10/26-31/21
23
38
23
11
6/14-20/22
27
31
24
11
Table 1: Trend in abortion policy preference, 2012-2022
There is little difference in enthusiasm to vote except among those who think abortion should be illegal in most cases. Those in the two pro-abortion categories, and those with the most anti-abortion preference are all equally motivated to vote. This gives no support for the idea that the abortion issue would be uniquely motivating to pro-abortion voters. Of course this could change, but the draft opinion does not appear to have motivated supporters of abortion to greater political engagement. Rather those who say abortion should be illegal in most cases are the more enthusiastic to vote in these data.
Abortion policy preference
Very enthusiastic
Less enthusiastic
DK/Ref
Legal in all cases
56
42
2
Legal in most cases
56
42
1
Illegal in most cases
68
32
0
Illegal in all cases
57
43
0
Table 2: Enthusiasm to vote by abortion policy preference
Abortion policy preference and concern about the issue
Those who think abortion should always be legal or always be illegal are the most concerned about abortion policy, while those in the middle categories of legal in most cases or illegal in most cases are substantially less concerned.
Those with the strongest anti-abortion preference express more concern for abortion policy than do the strongest pro-abortion advocates by a small margin.
Abortion policy preference
Very concerned
Less concerned
DK/Ref
Legal in all cases
66
34
0
Legal in most cases
53
46
1
Illegal in most cases
51
42
7
Illegal in all cases
73
27
0
Table 3: Concern about the issue of abortion by abortion policy preference
Age and abortion preference and concern
There is virtually no relationship between age and abortion preference. Only those 70 years old or older are a bit less supportive of abortion than the other age groups.
Age
Legal in all or most
Illegal in all or most
Don’t know
18-29
62
38
1
30-39
60
30
6
40-49
60
34
5
50-59
60
35
5
60-69
57
35
5
70+
51
40
7
Table 4: Abortion policy preference by age
Concern over the abortion issue is also not associated with age. Concern fluctuates across age groups but is not consistently higher among the young than it is among their elders. These results suggest it is unlikely that the abortion issue will be uniquely motivating for younger voters in the fall elections.
Age
Very concerned
Less concerned
DK/Ref
18-29
62
38
0
30-39
46
54
0
40-49
55
43
3
50-59
66
33
1
60-69
55
41
4
70+
64
32
4
Table 5: Concern about abortion policy by age
Partisanship and concern about abortion policy
Democrats say they are more concerned about the abortion issue, followed by Republicans while independents express less concern about the issue.
Party ID
Very concerned
Less concerned
DK/Ref
Republican
57
41
2
Independent
49
49
2
Democrat
73
26
1
Table 6: Abortion policy concern by party identification
While Democrats express more concern about abortion, they are less likely than Republicans to say they are very enthusiastic about voting in November.
Party ID
Very enthusiastic
Less enthusiastic
DK/Ref
Republican
74
26
0
Independent
49
49
1
Democrat
60
39
1
Table 7: Enthusiasm to vote by party identification
Enthusiasm to vote by party and abortion policy preference
Enthusiasm to vote is highest among Republicans, and equally so for pro- and anti-abortion policy preferences. Among independents, those opposed to abortion are more enthusiastic than those supporting abortion. Among Democrats who are pro-abortion, enthusiasm is less than among Republicans. There are very few Democrats who are anti-abortion, but among this group enthusiasm is low, about the same as for pro-abortion independents.
Party ID
Abortion policy
Very enthusiastic
Less enthusiastic
Republican
Legal all or most cases
73
27
Republican
Illegal all or most cases
73
27
Independent
Legal all or most cases
45
53
Independent
Illegal all or most cases
57
43
Democrat
Legal all or most cases
61
38
Democrat
Illegal all or most cases
48
52
Table 8: Enthusiasm to vote by abortion policy preference and party identification
Conclusion
A week before the Supreme Court struck down Roe v Wade, Wisconsin Republicans were more motivated to vote than Democrats, and pro-abortion policy preference was not associated with greater enthusiasm to vote. Enthusiasm was higher among those saying abortion should be illegal in most cases while quite similar among those saying abortion should be legal in all or most cases, and for those saying it should be illegal in all cases.
The Court’s now official decision overturning Roe, and the subsequent political campaigns on the issue, may shift motivation and participation, but the leak of the draft of that opinion in May did not produce a measurable mobilization among those favoring abortion rights, contrary to some speculation.
Public opinion substantially favors allowing concealed carry of handguns with a permit or license required. This is true of both a constitutional right under the Second Amendment and as provided by state laws. In contrast, there is substantial majority opposition to laws allowing concealed carry without a licensing requirement, or “permitless” carry.
Nationwide, 66% of those with an opinion favor a Supreme Court ruling that the Second Amendment includes a right to possess a gun outside the home. For state laws, 62% favor laws that allow concealed carry of handguns with a license and 38% are opposed.
In contrast, permitless concealed carry without a license requirement is supported nationwide by 19% and opposed by 81%.
In the 25 states with permitlesss concealed carry laws, a minority of 28% of adults favor such laws, while 72% are opposed to them, based on a May 2022 Marquette Law School national survey.
State surveys in Texas and Tennessee, states with unlicensed concealed carry laws, found 34% and 39% favored these laws, respectively, with 59% opposed in both states.
State gun laws
In the following analysis, state gun laws are grouped into four categories.
Twenty-five states have adopted laws allowing “permitless” concealed carry, requiring no license or permit to have a concealed weapon. (This includes Alabama, Indiana and Ohio that have adopted such a law that will go into effect by Jan. 1, 2023.)
Ten states have “shall issue” laws that give no discretion over issuing a license or permit to an applicant meeting the criteria specified by law.
Seven states have “shall issue” laws that allow some discretion over issuing a license or permit if the applicant is judged to raise some public safety concerns.
Eight states and the District of Columbia have “may issue” laws that give authorities greater lattitude in determining when to issue a license or permit.
Classifications of states were based on these websites which were checked for consistency:
The Marquette Law School Poll surveyed 1,004 adults nationwide May 9-19, 2022. The margin of error is +/-3.9 percentage points. The survey focused on the Supreme Court and included three items on opnion about the Second Amendment and concealed carry laws. The survey began before the mass shooting that killed 10 people in Buffalo, NY, and was completed before the mass shooting that killed 21 in a Uvalde, TX elementary school.
Full results of the Marquette Law School poll are available here.
Second Amendment
The Supreme Court is set to decide New York State Rifle & Pistol Association Inc. v. Bruen, which addresses whether the Second Amendment protects the right to possess a gun outside the home.
The survey asked
Do you favor or oppose the following possible future Supreme Court decisions, or haven’t you heard enough about this to have an opinion?: Rule that the 2nd Amendment right to “keep and bear arms” protects the right to carry a gun outside the home.
Among those with an opinion, 66% favor such a ruling and 34% are opposed.
Opinion on this extension of Second Amendment interpretation to include guns outside the home is more supportive in states with less restrictive gun laws, with large majorities favoring expanded rights to possess a gun, and less supportive in the most restrictive states, where opinion is evenly divided. These results are shown in Table 1.
State gun laws
Favor
Oppose
Permitless
77
23
Shall issue
70
30
Shall issue w limits
64
36
May issue
48
52
Table 1: Favor or oppose Supreme Court ruling that the 2nd Amendment right to ‘keep and bear arms’ protects the right to carry a gun outside the home, by state gun laws,among those with an opinion, May 2022
Concealed carry with a license
The Marquette Law School poll also asked about laws concerning concealed carry. Respondents were asked about licensed concealed carry laws:
Do you favor or oppose laws that allow most people to obtain a license to carry concealed handguns?
These laws were favored by 62% and opposed by 38% nationwide.
Opinion by state gun laws finds over 60% majorities in favor of such laws in most states, and with a narrow majority in favor in the states with the most restrictive laws concerning concealed carry, as shown in Table 2.
State gun laws
Favor
Oppose
Permitless
65
35
Shall issue
66
34
Shall issue w limits
64
36
May issue
53
47
Table 2: Do you favor or oppose laws that allow most people to obtain a license to carry concealed handguns, by state gun laws, May 2022
Concealed carry without a license (“Permitless”)
Half of the states now allow concealed carry without requiring a license or a permit. Respondents were asked
Do you favor or oppose laws that allow most people to carry concealed handguns without needing to obtain a license?
Opinion on this law is much more opposed than for licensed concealed carry. Nineteen percent favor unlicensed carry laws, while 81% are opposed to such laws.
Table 3 shows opinion on these laws by state gun laws. It is striking that even in the states that allow permitless concealed carry, 72% of adults are opposed to such a law. Opposition to these laws inceases in states with more restrictive gun laws.
State gun laws
Favor
Oppose
Permitless
28
72
Shall issue
19
81
Shall issue w limits
16
84
May issue
10
90
Table 3: Do you favor or oppose laws that allow most people to carry concealed handguns without needing to obtain a license?, by state gun laws, May 2022
Comparison with other national and state polls
National polls
In the Pew American Trends Panel wave 87, April 5-11, 2021 respondents were asked
Please indicate whether you would favor or oppose the following proposals about gun policy: Allowing people to carry concealed guns without a permit
In the Pew survey, permitless carry was favored by 20% and opposed by 79%, with 1% refusing to answer.
The May 2022 Marquette Law School national survey question asks
Do you favor or oppose laws that allow most people to carry concealed handguns without needing to obtain a license?
In the MU Law Poll permitless carry was favored by 19% and opposed by 81%.
Pew does not release the state code as part of the public dataset, so it is not possible to merge the Pew data with state laws.
State polls
This is not a comprehensive collection of state polls on unlicensed concealed carry but is illustrative of state opinion in one “shall issue” state and two states with permitless concealed carry laws.
Wisconsin
Wisconsin is a “shall issue” state that does require a license for concealed carry. The Marquette Law School poll of Wisconsin registered voters has asked about both licensed and unlicensed concealed carry. The results for licensed concealed carry are shown in Table 4 and for unlicensed carry in Table 5.
Poll dates
Favor
Oppose
Don’t know
Refused
1/21-24/16
63
31
5
1
1/8-12/20
70
25
5
0
10/26-31/21
62
29
8
1
4/19-24/22
69
26
5
0
Table 4: Do you favor or oppose Wisconsin’s current law allowing residents to obtain a license to carry concealed handguns?, Wisconsin registered voters
Poll dates
Favor
Oppose
Don’t know
Refused
10/26-31/21
20
76
3
0
4/19-24/22
16
82
2
0
Table 5: Do you favor or oppose a proposed law that would allow residents to carry concealed handguns without needing to obtain a license?, Wisconsin registered voters
Texas
Texas allows concealed carrry without requiring a license.
A Univerity of Texas/Texas Tribune poll conducted in April 2021 asked
Should adults be allowed to carry handguns in public without licenses or permits?
This was supported by 34% and opposed by 59% with 6% saying the don’t know.